Access more sample types: Compatible with both FFPE and fresh frozen tissue samples.
Whole tissue section profiling: No need to select regions of interest—analyze the whole transcriptome from an entire section.
High cellular resolution: 1–10 cell resolution on average per spot depending on tissue type.
Diverse sample compatibility: Demonstrated data on a diverse set of organs across species (human, mouse, rat, and more).
Protein co-detection: Combine whole transcriptome spatial analysis with immunofluorescence protein detection.
Streamlined data analysis: Combine histological and gene expression data with easy-to-use software.
Workflow
1. Prepare your sample
Embed, section, and place fresh frozen or FFPE tissue onto a Capture Area of the gene expression slide. Each Capture Area has thousands of barcoded spots containing millions of capture oligonucleotides with spatial barcodes unique to that spot.
2. Stain and image the tissue
Use standard fixation and staining techniques, including hematoxylin and eosin (H&E) staining, to visualize tissue sections on slides using a brightfield microscope and immunofluorescence (IF) staining to visualize protein detection in tissue sections on slides using a fluorescent microscope.
3. Permeabilize tissue and construct library
For fresh frozen tissue, the tissue is permeabilized to release mRNA from the cells, which binds to the spatially barcoded oligonucleotides present on the spots. A reverse transcription reaction produces cDNA from the captured mRNA. The barcoded cDNA is then pooled for downstream processing to generate a sequencing-ready library. For FFPE tissues, tissue is permeabilized to release ligated probe pairs from the cells, which bind to the spatially barcoded oligonucleotides present on the spots. Spatial barcodes are added via an extension reaction. The barcoded molecules are then pooled for downstream processing to generate a sequencing-ready library.
4. Sequence
The resulting 10x barcoded library is compatible with standard NGS short-read sequencing on Illumina sequencers for massive transcriptional profiling of entire tissue sections.
5. Analyze and visualize your data
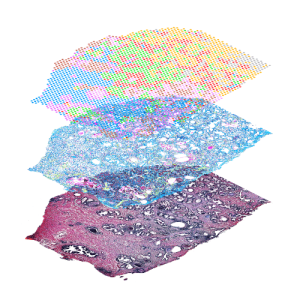
Use our Space Ranger analysis software to process your spatial gene and protein expression data and interactively explore the results with our Loupe Browser visualization software.
(DO I NEED TO BE A BIOINFORMATICIAN TO USE LOUPE? Loupe is a point-and-click software that’s easy for anyone to download and use.)
FAQ
What does Visium Spatial Gene Expression enable you to do?
What types of samples are compatible?
Is this a proven technology?
How do I analyze my Visium Spatial Gene Expression data?
10x Genomics provides two types of software to help you analyze your data: Space Ranger and Loupe Browser. Space Ranger is an analysis software that automatically overlays spatial gene expression information on your tissue image and identifies clusters of spots with similar transcription profiles. You can then use Loupe Browser, a visualization software, to interactively explore the results.
Does the Visium assay require tissue optimization?
The Visium Spatial Gene Expression for FFPE tissues assay does not require tissue optimization. However, the Visium Spatial Gene Expression assay for fresh frozen tissues does require tissue optimization due to differences in the chemistry and molecular biology between the Visium assays for the two sample preparation types.
What tissue stains are compatible with Visium Spatial Gene Expression?
Visium Spatial Gene Expression for fresh frozen and FFPE is compatible with hematoxylin and eosin H&E staining for morphological information and with IF staining for protein co-detection.