We recently discussed the key features of our Visium Spatial Gene Expression and Xenium In Situ spatial transcriptomics platforms, including technical considerations like plexity, sensitivity, and resolution, among others. This information provides a foundation from which you can start to consider which platform is the best fit for your current applications or if they should be used together.
In the same way that a picture is worth a thousand words, real-world examples of how others have tackled this decision are also helpful. So, how have other scientists used these spatial transcriptomics tools to address their biological questions? What were the strengths of Visium and Xenium that fueled the insights in each study? How have others built on the insights from one technology to inform experiments with the other?
In the sections below, we aim to help you answer these questions by highlighting publications and pre-prints that have used both Visium and Xenium to study the same biological system, but from different angles and with different goals.
Mapping tumor–immune composition in early stages of human lung cancer
Cancer evolves through mutations that help it survive the selective pressure of both our biology and the tumor microenvironment. This leads to cancer cells evading the immune system, resisting apoptosis, dividing uncontrollably, and becoming more invasive.
The Suzuki lab (University of Tokyo) studied lung adenocarcinoma in situ (AIS) and its subtypes (Noguchi types A, B, and C), which are early, non-invasive stages with high survival rates after surgery. They aimed to understand the molecular events that drive progression to invasive cancer.
Using bulk RNA-seq and gene ontology analyses, they found distinct signatures: type A AIS showed dysregulated cell growth genes, while type B had upregulated immune-related genes and more cytotoxic lymphocytes. Visium Spatial Gene Expression confirmed these findings, localizing immune cells in type B tumors. Single-cell deconvolution revealed FABP4 and SPP1-expressing macrophages near alveolar collapse, suggesting their role in disease progression.
Xenium In Situ analysis provided a single-cell view, targeting 302 genes in over 400,000 cells from type A and type B cases. It showed SPP1+ and FABP4+ macrophages in type B tumors and polarization between M1 proinflammatory and M2 anti-inflammatory macrophages, influencing tumor microenvironment functions.
Combining Visium and Xenium offered insights into cellular differences and immune processes driving AIS progression, revealing how whole transcriptome and targeted single-cell analysis can uncover tumor biology.

Figure 1. (e) Visium spatial transcriptomic analysis for three representative cases (TSU-20, TSU-21, and TSU-33). Expression patterns of marker genes for well-differentiated tumor cells (NAPSA) and alveolar macrophages (MARCO) are represented. (f) Enrichment scores of transcriptome signature genes in the corresponding histological types in Visium data. (h) Spatial expression patterns of tumor cell markers in Visium data. Image adapted from Figure 6 from Haga et al. 2023. (CC BY 4.0).

Figure 2. Single cell spatial analysis of case TSU-21 using Xenium In Situ. (i) Spatial distribution (left) and UMAP (right) of cell clusters identified by Xenium. (j) Xenium spatial expression pattern of an alveolar macrophage marker MARCO (left). Patterns of several macrophage markers in local regions (middle and right). Each dot represents a detected RNA molecule. Image adapted from Figure 6 from Haga et al. 2023. (CC BY 4.0).
Defining the cellular-molecular organization of the mouse thalamus
The thalamus is a crucial brain center organized into nuclei that handles various motor and sensory signals. It supports thinking, memory, attention, emotion regulation, sensory processing, and sleep, making it a key focus for neuroscientists.
Researchers from the University of British Columbia mapped the cellular and molecular landscape of the mouse thalamus using single-cell RNA sequencing (scRNA-seq) and Visium spatial transcriptomics. They aimed to understand how specific neuronal cell types and their spatial organization drive thalamic functions.
They created a map of cell types within the anterior thalamic nuclei (ATN), resolving cell-type assignments and marker genes. Single-cell clusters aligned with the three ATN subregions: the anterodorsal (AD), anteromedial (AM), and anteroventral (AV) nuclei. Visium data revealed cellular heterogeneity within the ATN and identified clusters in other thalamic nuclei. The AV nucleus showed a gradual change in cell-type identity across the dorsomedial-ventrolateral axis.

Figure 3. Integrating spatial transcriptomics (ST) and scRNA-seq captures the distinct nuclei of the ATN within the broader thalamus. (A) Depiction of a representative brain section used for ST. Gray points illustrate spots corresponding to the ATN that were used for analysis, with NeuN and DAPI labeling in green and blue, respectively. Inset provides UMAP embedding for spots corresponding to the ATN. (B, C) UMAP dimensionality reduction and clustering across all ATN spots, with coloring representing cluster identity, then spatial location of spots for the representative section. (D) UMAP dimensionality and clustering from scRNA-seq data. (E–H) Predicted spatial locations of clusters from scRNA-seq data, with each spot denoting likelihood of location based on coherence with ST data. (I–K) Expression of cluster-specific markers within the ST dataset. Image adapted from Figure 2 from Kapustina et al. 2024. (CC BY 4.0).
For higher resolution, they used Xenium In Situ analysis on seven mouse ATN tissue sections, identifying 384,076 cells, including 4,476 excitatory neurons within the ATN. This confirmed the three ATN subregions and distinguished further cellular subclusters. They identified a unique cell subtype in the AV expressing genes of both astrocytes and excitatory neurons, confirming the gene expression gradient.
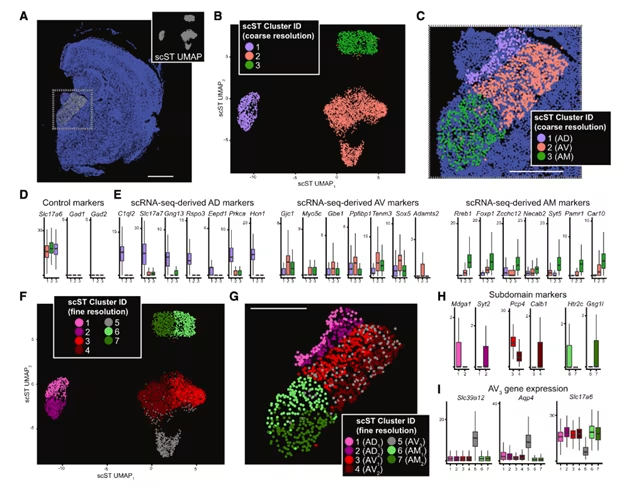
Figure 4. Spatially patterned heterogeneity within all nuclei of the ATN. (A) Depiction of a representative brain section used for Xenium single cell spatial transcriptomics (scST). Gray points illustrate spots corresponding to the ATN that were used for analysis, with blue points labeling other cells not included in the analysis. Inset provides UMAP embedding for spots corresponding to the ATN. (B) UMAP dimensionality reduction and clustering across all ATN cells, with coloring representing cluster identity. (C) Spatial location of spots for the representative section. (F) Clustering at finer resolution, mapped to spatial location (G). Image adapted from Figure 6 from Kapustina et al. 2024. (CC BY 4.0).
This combined application of single cell, Visium, and Xenium technology ultimately points to their collective value to untangle and refine subtle cellular heterogeneity in a complex tissue system, and to map spatially relevant gene expression changes that can reveal the interplay of cellular identity, location, and function. These insights into the ATN may help researchers come closer to understanding the cellular and molecular mechanisms underlying the diverse information-processing functions of the thalamus.
Tracking the development of cleft palate
An organism’s development involves complex cell division and differentiation, with occasional missteps like cleft palate, where the mouth roof fails to close, linked to environmental and genetic factors. To understand cleft palate, the D’Souza group at the NIH studied genes involved in normal palate fusion in embryonic mice using Visium analysis on FFPE coronal mid-palatal sections. They identified three new genes—Deup1, Dynlrb2, and Lrrc23—involved in cilia function, suggesting nasal epithelium cells aid palate fusion.

Figure 5. Mid-palatal coronal cross sections of whole embryo heads were placed on barcoded Visium slides. (A) In vivo clusters were defined from the whole embryo head, demonstrating spatial relationships and morphogenetic diversity of expression, further filtered for only those clusters encoded on the barcodes placed within the palate tissue in each respective section to identify top differentially expressed genes (B) from E14.5 vs. E15.5 in the palate. (C) Spatial gene expression feature plots for the three enriched genes identified. (D) Colored circles correspond to 55 μm–diameter Visium v2 transcriptomic resolution. Increased expression levels, delineated using Loupe Browser, are represented here with darker shades of green (Deup1), blue (Dynlrb2), or red (Lrrc23). The combined localization of these genes is indicated by overlapping concentric colored circles, the diameter of which does not correspond to degree of expression. Image adapted from Figure 5 from Piña et al. 2023. (CC BY 4.0).
They then explored cleft palate in the Pax9-/- transgenic mouse model. Pax9 affects the Wnt signaling pathway, crucial for development. Using Single Cell Multiome ATAC + Gene Expression, they analyzed gene expression and chromatin in wild-type (WT) and Pax9-/- mice palates, finding a mesenchymal subcluster enriched in Pax9 RNA.
In Pax9-/- mice, increased osteoprogenitor cells and greater chromatin accessibility for Wnt modulators Dkk1 and Dkk2 indicated altered Wnt dynamics. They further examined using Xenium In Situ for single cell spatial imaging on FFPE whole-head sections of WT and Pax9-/- mice.
Xenium data revealed 28 cell clusters. Differences in palate clusters due to Pax9 absence included lower expression of Wnt5a and Wnt7b in Pax9-/- mice. Increased Dkk1 and Dkk2 expression and specific spatial patterns were noted, with Dkk2 on the mesial midline border and deficiencies in other Wnt pathway genes.

Figure 6. Using Xenium to transcriptomically and morphologically characterize palate in WT and Pax9-/- mice. (A) Coronal whole-head sections of embryonic WT and Pax9-/- mice processed with Xenium-based cell clusters (second row) and stained with H&E post-Xenium (first row). Spatial location of the Wnt modulators Dkk1 and Dkk2 (third row), showing distinct patterns of expression, as well as Sp7 (a palatine bone border marker). Image adapted from Figures 3 and 4 from Piña et al. 2023. (CC BY 4.0).
These findings suggest Pax9 is crucial for mesenchyme cell commitment in the palate, with its absence leading to Dkk2 expression that inhibits Wnt-induced osteogenesis, possibly causing cleft palate.
Resolving heterogeneity in ductal carcinoma in situ breast cancer
Understanding how cancers transition from in situ to invasive is crucial, especially in breast cancer. Ductal carcinoma in situ (DCIS) is the earliest stage, so characterizing cellular and molecular heterogeneity within the tumor microenvironment is vital for understanding disease progression and informing treatment decisions.
A team of 10x Genomics scientists used Chromium Gene Expression Flex, Visium CytAssist, and Xenium In Situ to analyze a human FFPE DCIS tissue block. They mapped cellular composition and spatial organization using single cell (scFFPE-seq) and Visium spatial analysis, identifying three tumor domains—two distinct DCIS types and an invasive region—alongside immune, stromal, and adipocyte cells.
Xenium’s 313-plex human breast panel provided subcellular spatial resolution, revealing a HER2+/ER+/PR+ region, indicating a new cancer subtype within the sample. Integrated single cell data clarified cellular composition and markers distinguishing invasive and DCIS regions, with DCIS #2 showing higher invasive potential than DCIS #1.
Visium whole transcriptome analysis further characterized the triple-positive region found by Xenium. Deconvolving Visium data with Xenium data identified differentially expressed genes, revealing distinct functions: estrogen receptor signaling in PGR+ regions, metabolism in DCIS #1, and interferon signaling in DCIS #2.

Figure 7. Visium and Xenium integration derive differentially expressed genes in a triple-positive receptor ROI. (a) Xenium spatial plot for ERBB2 (HER2—gray), ESR1 (estrogen receptor—green), and PGR (progesterone receptor—magenta) decoded transcripts. (b) Closer view of triple-positive ROI. (c) Corresponding H&E image. (d) Cell types contained within ROI reveal that this is a DCIS #2 tumor epithelium. (e) Individual Xenium spatial plots from (b). (f) Chromium scFFPE-seq yields only about 30 cells that are positive for PGR, but these cells do not express ERBB2 or ESR1. (g) Triple-positive region is identified in Visium (given a priori knowledge from Xenium) and is (h) part of a distinct cluster. (i) Spot interpolation provides cell-type frequencies within each Visium spot. (j) Visium H&E and four representative differentially expressed genes in the tumor epithelium revealed by Visium data across the whole transcriptome. Image adapted from Figure 5 from Janesick et al. 2023. (CC BY 4.0).
This study shows that a “simple” DCIS sample can be highly heterogeneous, containing various tumor subtypes that influence cancer classification, progression, and therapeutic response. Integrated single cell and spatial approaches, combined with targeted analysis, clarify this heterogeneity and identify critical cell states and biomarkers involved in progression to invasive carcinoma.
References
- Haga Y, et al. Whole-genome sequencing reveals the molecular implications of the stepwise progression of lung adenocarcinoma. Nat Commun 14: 8375 (2023). doi: 10.1038/s41467-023-43732-y
- Suzuki Y. High-resolution analysis of lung cancers reveals heterogeneity in tumor microenvironments. 10x Genomics Webinar (2023). https://www.10xgenomics.com/videos/kx615e0tof?autoplay=true
- https://my.clevelandclinic.org/health/body/22652-thalamus
- Kapustina M, et al. The cell-type-specific spatial organization of the anterior thalamic nuclei of the mouse brain. Cell Rep 43: 113842 (2024). doi: 10.1016/j.celrep.2024.113842
- Piña J, et al. Multimodal spatiotemporal transcriptomic resolution of embryonic palate osteogenesis. Nat Commun 14: 5687 (2023). doi: 10.1038/s41467-023-41349-9
- Piña J, et al. Spatial multiomics reveal the role of Wnt modulator, Dkk2, in palatogenesis. bioRxiv (2023). doi: 10.1101/2023.05.16.541037
- Janesick A, et al. High resolution mapping of the tumor microenvironment using integrated single-cell, spatial and in situ analysis. Nat Commun (2023). 14: 8353. doi: 10.1038/s41467-023-43458-x
------------
GENESMART CO., LTD | Phân phối ủy quyền 10X Genomics, Altona, Biosigma, Hamilton, IT-IS (Novacyt), Norgen Biotek, Rainin tại Việt Nam.